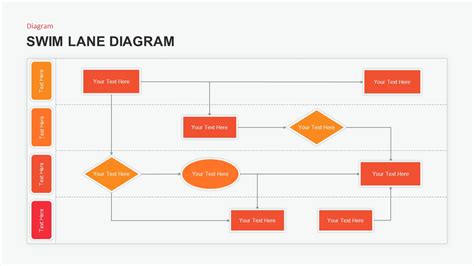
Business process mapping is a crucial aspect of organizational management, enabling companies to visualize, analyze, and improve their workflows. Among the various tools used for this purpose, swimlane diagrams have gained popularity due to their ability to clearly illustrate the roles and responsibilities of different teams or departments within a process. Here's a comprehensive guide on creating a swimlane diagram PowerPoint template for business process mapping.
Why Use Swimlane Diagrams?
Before diving into the details of creating a swimlane diagram PowerPoint template, let's quickly explore why these diagrams are useful:
- Clear Visualization: Swimlane diagrams provide a clear and concise visual representation of a business process, making it easier to understand and analyze.
- Role Clarity: By organizing tasks into lanes based on the responsible teams or departments, swimlane diagrams help clarify roles and responsibilities.
- Improved Communication: These diagrams facilitate communication among team members and stakeholders by providing a shared understanding of the process.
- Efficient Process Improvement: Swimlane diagrams enable organizations to identify inefficiencies and areas for improvement, leading to enhanced productivity and reduced costs.
Creating a Swimlane Diagram PowerPoint Template
To create a swimlane diagram PowerPoint template for business process mapping, follow these steps:
Step 1: Plan Your Diagram
Before creating your swimlane diagram, define the business process you want to map. Identify the following:
- Process Name: Give your process a clear and concise name.
- Teams or Departments: Determine the teams or departments involved in the process.
- Tasks and Activities: Break down the process into individual tasks and activities.
- Sequence and Dependencies: Establish the sequence of tasks and dependencies between them.
Step 2: Set Up Your PowerPoint Template
Open PowerPoint and create a new presentation. Set up your template with the following elements:
- Slide Layout: Choose a landscape orientation and a suitable layout for your diagram.
- Background: Select a neutral background color or image that will not distract from your diagram.
- Font and Color Scheme: Choose a clear font and a color scheme that aligns with your organization's brand.
Adding Swimlanes
To create swimlanes, use the following steps:
- Insert a Table: Go to the "Insert" tab and select "Table." Create a table with the desired number of rows and columns.
- Adjust Column Widths: Adjust the column widths to create the swimlanes. Typically, the first column is used for the task names, and the subsequent columns represent the teams or departments.
- Add Lane Headers: Enter the team or department names in the first row of each column.
Adding Tasks and Activities
To add tasks and activities to your swimlane diagram, follow these steps:
- Insert Text Boxes: Use the "Text Box" tool to add tasks and activities to each swimlane.
- Align Text Boxes: Align the text boxes to the corresponding swimlane and adjust their size as needed.
- Add Arrows and Connectors: Use the "Shapes" tool to add arrows and connectors to illustrate the sequence and dependencies between tasks.
Step 3: Customize and Refine Your Template
Once you have created the basic structure of your swimlane diagram, customize and refine your template:
- Add Visuals and Icons: Incorporate visuals and icons to make your diagram more engaging and easy to understand.
- Use Colors and Highlights: Use colors and highlights to differentiate between tasks, teams, and departments.
- Add Legends and Keys: Create a legend or key to explain the symbols and colors used in your diagram.
Example of a Swimlane Diagram PowerPoint Template
Here's an example of a swimlane diagram PowerPoint template for a simple order fulfillment process:

Tips and Variations
- Use Different Shapes and Symbols: Experiment with different shapes and symbols to represent tasks, teams, and departments.
- Incorporate Images and Graphics: Add images and graphics to make your diagram more visually appealing.
- Create a Swimlane Diagram with Multiple Levels: Use multiple levels or sub-swimlanes to illustrate complex processes with multiple teams or departments.
Gallery of Swimlane Diagrams
Here's a gallery of swimlane diagrams for different business processes:


Frequently Asked Questions
Here are some frequently asked questions about swimlane diagrams:
What is a swimlane diagram?
+A swimlane diagram is a type of business process mapping tool that visually represents a process and its associated tasks, teams, and departments.
Why use swimlane diagrams?
+Swimlane diagrams provide a clear and concise visual representation of a business process, making it easier to understand and analyze. They also help clarify roles and responsibilities and facilitate communication among team members and stakeholders.
How do I create a swimlane diagram?
+To create a swimlane diagram, define the business process you want to map, identify the teams or departments involved, and break down the process into individual tasks and activities. Use a tool like PowerPoint to create the diagram, and customize it with visuals, icons, and colors.
By following these steps and tips, you can create a swimlane diagram PowerPoint template that effectively maps your business processes and improves communication and collaboration among team members and stakeholders.
