Quad charts are an essential tool for visualizing and communicating complex data in a clear and concise manner. They are widely used in business, finance, and academia to present information in a structured and easy-to-understand format. In this article, we will explore the concept of quad charts, their benefits, and provide a step-by-step guide on how to create a quad chart PowerPoint template.
What is a Quad Chart?
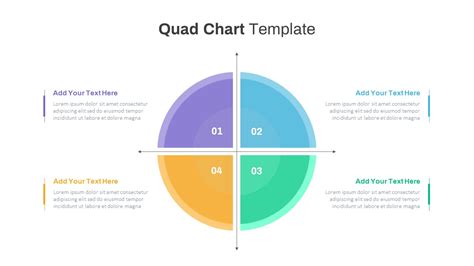
A quad chart, also known as a quadrant chart or 2x2 matrix, is a graphical representation of data that uses four quadrants to display information. Each quadrant represents a different combination of two variables, allowing users to quickly identify relationships, patterns, and trends. Quad charts are commonly used to:
- Compare and contrast different options or scenarios
- Identify strengths, weaknesses, opportunities, and threats (SWOT analysis)
- Visualize market trends and competitor analysis
- Present data in a clear and concise manner
Benefits of Using a Quad Chart
Quad charts offer several benefits, including:
- Simplified data visualization: Quad charts make it easy to understand complex data by breaking it down into four distinct quadrants.
- Improved decision-making: By visualizing data in a quad chart, users can quickly identify patterns and trends, making it easier to make informed decisions.
- Enhanced communication: Quad charts are an effective way to communicate complex data to stakeholders, including colleagues, clients, and investors.
- Increased efficiency: Quad charts can save time and effort by providing a quick and easy way to analyze and present data.
How to Create a Quad Chart PowerPoint Template
Creating a quad chart PowerPoint template is a straightforward process that can be completed in a few steps. Here's a step-by-step guide:
Step 1: Determine the Variables
The first step in creating a quad chart is to determine the two variables that you want to display. These variables should be related to the data you want to present and should be relevant to your audience. For example, if you're creating a quad chart to compare different marketing strategies, your variables might be "Cost" and "Effectiveness."
Step 2: Set Up the Quad Chart Template
To set up the quad chart template, follow these steps:
- Open PowerPoint and create a new slide.
- Go to the "Insert" tab and click on "Table."
- Select a 2x2 table and click "OK."
- Resize the table to fit your slide.
Step 3: Label the Quadrants
Label each quadrant with the corresponding variable combinations. For example:
- Quadrant 1: High Cost, High Effectiveness
- Quadrant 2: High Cost, Low Effectiveness
- Quadrant 3: Low Cost, High Effectiveness
- Quadrant 4: Low Cost, Low Effectiveness
Step 4: Add Data and Images
Add data and images to each quadrant to illustrate the information you want to present. You can use text, images, charts, or other visual elements to make your quad chart more engaging and informative.
Step 5: Customize the Template
Customize the template to fit your needs. You can change the colors, fonts, and layout to match your brand or style.
Tips and Variations
Here are some tips and variations to enhance your quad chart PowerPoint template:
- Use different colors: Use different colors to highlight each quadrant and make the data more visually appealing.
- Add images: Use images to illustrate each quadrant and make the data more engaging.
- Use icons: Use icons to represent each variable and make the data more concise.
- Create a legend: Create a legend to explain the variables and data used in the quad chart.

Common Applications of Quad Charts
Quad charts are widely used in various fields, including:
- Business: Quad charts are used to compare and contrast different business strategies, identify market trends, and analyze competitor data.
- Finance: Quad charts are used to analyze financial data, identify investment opportunities, and compare different financial scenarios.
- Academia: Quad charts are used to present research data, compare different theories, and analyze complex data.
Best Practices for Creating Effective Quad Charts
Here are some best practices for creating effective quad charts:
- Keep it simple: Keep the data and labels simple and concise.
- Use clear labels: Use clear and descriptive labels for each quadrant.
- Use visual elements: Use visual elements, such as images and icons, to make the data more engaging.
- Use colors effectively: Use colors effectively to highlight each quadrant and make the data more visually appealing.
Gallery of Quad Chart Examples


FAQs
What is a quad chart?
+A quad chart is a graphical representation of data that uses four quadrants to display information.
What are the benefits of using a quad chart?
+The benefits of using a quad chart include simplified data visualization, improved decision-making, enhanced communication, and increased efficiency.
How do I create a quad chart PowerPoint template?
+To create a quad chart PowerPoint template, follow the steps outlined in this article, including determining the variables, setting up the template, labeling the quadrants, adding data and images, and customizing the template.
By following these steps and tips, you can create an effective quad chart PowerPoint template that helps you communicate complex data in a clear and concise manner. Whether you're presenting data to stakeholders, analyzing market trends, or comparing different options, a quad chart is a powerful tool that can help you achieve your goals.
