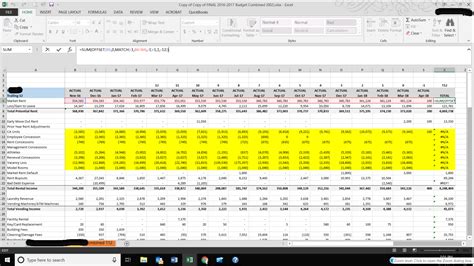
Creating a 12-month rolling forecast is a crucial task for businesses to predict future financial performance and make informed decisions. A rolling forecast is a dynamic forecast that updates automatically as new data becomes available, providing a continuous view of future performance. In this article, we will explore the importance of a 12-month rolling forecast and provide a step-by-step guide to creating one using an Excel template.
Why is a 12-Month Rolling Forecast Important?
A 12-month rolling forecast is essential for businesses to:
- Predict future financial performance: A rolling forecast helps predict future financial performance by analyzing historical trends and current data.
- Make informed decisions: With a rolling forecast, businesses can make informed decisions about investments, resource allocation, and strategic planning.
- Identify potential risks and opportunities: A rolling forecast helps identify potential risks and opportunities, enabling businesses to take proactive measures to mitigate or capitalize on them.
How to Create a 12-Month Rolling Forecast with Excel Template
To create a 12-month rolling forecast with an Excel template, follow these steps:
Step 1: Gather Historical Data
Gather historical financial data for the past 12 months, including income statements, balance sheets, and cash flow statements.
Step 2: Set Up the Excel Template
Create a new Excel spreadsheet and set up the following columns:
| Column A | Column B | Column C | Column D | Column E | Column F |
|---|---|---|---|---|---|
| Month | Actual | Forecast | Variance | % Variance | Rolling Total |
Step 3: Enter Historical Data
Enter the historical financial data into the template, starting from the earliest month.
Step 4: Create a Forecast Formula
Create a forecast formula using a combination of historical data and industry benchmarks. For example, you can use a simple moving average formula:
=AVERAGE(B2:B13) (where B2:B13 is the range of historical data)
Step 5: Apply the Forecast Formula
Apply the forecast formula to each month, starting from the current month.
Step 6: Calculate Variance
Calculate the variance between the actual and forecast values using the following formula:
=B14-C14 (where B14 is the actual value and C14 is the forecast value)
Step 7: Calculate Percentage Variance
Calculate the percentage variance using the following formula:
= (B14-C14)/B14*100 (where B14 is the actual value and C14 is the forecast value)
Step 8: Calculate Rolling Total
Calculate the rolling total by adding the forecast values for each month.
Step 9: Update the Forecast
Update the forecast by adding new data and recalculating the forecast formula.
Excel Template Example
Here is an example of what the Excel template might look like:
| Month | Actual | Forecast | Variance | % Variance | Rolling Total |
|---|---|---|---|---|---|
| Jan-20 | 100,000 | 105,000 | -5,000 | -5% | 1,050,000 |
| Feb-20 | 110,000 | 115,000 | -5,000 | -5% | 1,165,000 |
| Mar-20 | 120,000 | 125,000 | -5,000 | -5% | 1,290,000 |
| ... | ... | ... | ... | ... | ... |
| Dec-20 | 150,000 | 155,000 | -5,000 | -5% | 1,725,000 |
Gallery of 12-Month Rolling Forecast Examples


FAQs
Q: What is a rolling forecast? A: A rolling forecast is a dynamic forecast that updates automatically as new data becomes available, providing a continuous view of future performance.
Q: Why is a 12-month rolling forecast important? A: A 12-month rolling forecast is essential for businesses to predict future financial performance, make informed decisions, and identify potential risks and opportunities.
Q: How do I create a 12-month rolling forecast in Excel? A: To create a 12-month rolling forecast in Excel, follow the steps outlined in this article, including gathering historical data, setting up the Excel template, entering historical data, creating a forecast formula, and updating the forecast.
We hope this article has provided you with a comprehensive guide to creating a 12-month rolling forecast with an Excel template. By following these steps, you can create a dynamic forecast that helps you predict future financial performance and make informed decisions.
