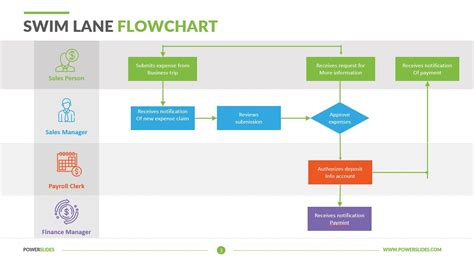
Business processes are the backbone of any organization, and visualizing them is essential for understanding, improving, and communicating these processes effectively. One of the most effective tools for process visualization is the Swim Lane Process Map, also known as Swim Lane Diagrams or Cross-Functional Flowcharts. These diagrams are particularly useful for illustrating the roles and responsibilities of different departments or teams within an organization in relation to a specific process.
Why Use Swim Lane Process Maps?
Swim Lane Process Maps offer several advantages over traditional process mapping techniques. They are excellent for:
- Interdepartmental Collaboration: By mapping processes across different departments, organizations can better understand how different teams interact and how processes flow across these boundaries.
- Process Optimization: Visualizing processes makes it easier to identify inefficiencies, bottlenecks, and areas for improvement.
- Communication and Training: Swim Lane diagrams are intuitive and can be used to communicate processes to stakeholders, including employees, clients, and management.
- Problem-Solving: They facilitate problem-solving by identifying which department or team is responsible for which part of the process.
Creating a Swim Lane Process Map in PowerPoint
PowerPoint is a versatile tool for creating presentations, and with a little creativity, it can also be used for process mapping. Here’s a step-by-step guide to creating a Swim Lane Process Map in PowerPoint:
1. Setting Up Your Slide
- Start by opening PowerPoint and creating a new slide or a new presentation.
- Ensure the slide is set to a wide layout, as this will give you ample space to create your process map.
2. Designing the Swim Lanes
- Draw the Swim Lanes: Use the “Rectangle” tool to draw boxes across the slide. Each box will represent a department or team (swim lane). You can use different colors for each box to differentiate between departments.
- Label the Swim Lanes: Use the “Text Box” tool to label each department or team within its respective box.
3. Adding Process Steps
- Identify Process Steps: Determine the steps involved in your process and where they fall within the swim lanes.
- Drawing Process Steps: Use shapes (e.g., rectangles, circles, or diamonds) to represent process steps. The choice of shape can denote different types of steps (e.g., decision points, tasks, or milestones).
- Adding Process Step Details: Use the “Text Box” tool to add descriptions, notes, or details about each process step.
4. Connecting Process Steps
- Drawing Arrows: Use the “Line” or “Arrow” tool to connect process steps, indicating the flow of the process. Make sure arrows start from one process step and end at another, showing the direction of the process flow.
- Using Different Arrow Types: Consider using different arrow styles or colors to denote different types of process flows (e.g., normal flow, exception flow).
5. Final Touches
- Review and Edit: Check your diagram for clarity, completeness, and accuracy. Edit as necessary.
- Add Legend: If you’ve used different shapes or colors to denote different things, consider adding a legend to explain these symbols.
- Save and Share: Once you’re satisfied, save your file and consider sharing it with relevant stakeholders.
6. Embedding Images
- To make your process map more engaging, you might want to embed images relevant to your process steps. For example, a picture of a product if your process involves manufacturing.
- Use the “Picture” tool to insert images, and ensure they are properly licensed for use.
Example for Gallery Section:


FAQ Section:
What is a Swim Lane Process Map?
+A Swim Lane Process Map is a type of process map that illustrates the roles and responsibilities of different departments or teams within an organization.
Why Use Swim Lane Diagrams?
+They are useful for interdepartmental collaboration, process optimization, communication, and training, as well as for problem-solving.
How Do I Create a Swim Lane Process Map in PowerPoint?
+Create swim lanes using the Rectangle tool, add process steps with shapes and text boxes, connect steps with arrows, and finalize with a review and any necessary edits.
If you have any questions about creating a Swim Lane Process Map in PowerPoint or want to share your own experiences, feel free to ask in the comments below. Sharing your knowledge can help improve processes for others.
