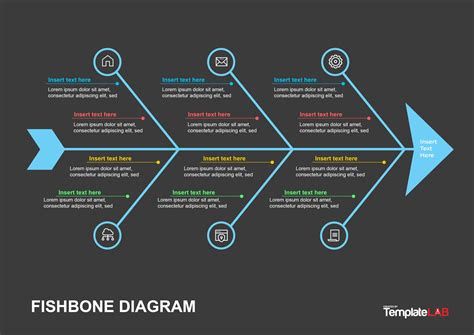
Root cause analysis is a crucial methodology used to identify the underlying causes of problems or events. One of the most popular tools used for this purpose is the Fishbone Diagram, also known as the Ishikawa Diagram or Cause-and-Effect Diagram. This template is designed to resemble a fishbone, with the problem statement at the head and various causes branching out from the spine.
Here's a comprehensive guide to creating a Lab Fishbone Template in Word for root cause analysis:
Importance of Root Cause Analysis
Root cause analysis is a structured approach to identifying the underlying causes of problems or events. It helps to identify the root causes of a problem, rather than just its symptoms. By using a Fishbone Diagram, you can visualize the relationships between different causes and identify the most likely root cause of a problem.
Creating a Lab Fishbone Template in Word
To create a Lab Fishbone Template in Word, follow these steps:
- Open a new Word document and set the page orientation to landscape.
- Draw a large fishbone shape on the page, with the head of the fish on the left side. You can use the drawing tools in Word to create the shape.
- Write the problem statement at the head of the fishbone.
- Identify the major categories of causes that may be contributing to the problem. These categories typically include:
- People (or Man)
- Machines (or Equipment)
- Materials
- Methods (or Processes)
- Environment
- Measurements (or Metrics)
- Draw a line branching out from the spine of the fishbone for each category.
- Brainstorm and list the potential causes within each category. These causes should be specific and relevant to the problem statement.
- Use arrows to connect the causes to the categories and the problem statement.
Example of a Lab Fishbone Template
Here's an example of a Lab Fishbone Template for a problem with a laboratory experiment:
Problem Statement: Experiment failed to produce expected results.
People (Man)
- Inadequate training of laboratory staff
- Insufficient experience with experimental procedures
- Human error in data collection
Machines (Equipment)
- Malfunctioning laboratory equipment
- Inadequate maintenance of equipment
- Poor calibration of instruments
Materials
- Poor quality of reagents or chemicals
- Inadequate storage of materials
- Contamination of samples
Methods (Processes)
- Inadequate experimental design
- Poor data collection methods
- Inconsistent procedures
Environment
- Laboratory temperature or humidity fluctuations
- Poor lighting or ventilation
- Distractions or interruptions during the experiment
Measurements (Metrics)
- Inadequate measurement tools or equipment
- Poor data analysis methods
- Inconsistent data recording practices
Analyzing the Fishbone Diagram
Once you have completed the Fishbone Diagram, analyze it to identify the most likely root cause of the problem. Look for:
- The category with the most potential causes
- The causes that are most closely related to the problem statement
- The causes that are most likely to have a significant impact on the problem
By using a Lab Fishbone Template, you can identify the underlying causes of problems or events in your laboratory and develop effective solutions to prevent similar problems from occurring in the future.
Benefits of Using a Fishbone Diagram
Using a Fishbone Diagram has several benefits, including:
- Helps to identify the root cause of a problem
- Encourages a structured approach to problem-solving
- Facilitates collaboration and communication among team members
- Provides a visual representation of the relationships between different causes
- Helps to identify and prioritize potential causes
Common Mistakes to Avoid
When using a Fishbone Diagram, avoid the following common mistakes:
- Focusing on symptoms rather than root causes
- Overlooking potential causes
- Not using specific and relevant language
- Not analyzing the diagram thoroughly
- Not using the diagram to develop effective solutions
Best Practices
To get the most out of your Fishbone Diagram, follow these best practices:
- Use a structured approach to identify potential causes
- Involve a diverse team of stakeholders in the brainstorming process
- Use specific and relevant language when listing causes
- Analyze the diagram thoroughly to identify the most likely root cause
- Use the diagram to develop effective solutions to prevent similar problems from occurring in the future
Gallery of Lab Fishbone Templates
Here are some examples of Lab Fishbone Templates:


FAQs
What is a Fishbone Diagram?
+A Fishbone Diagram is a visual tool used to identify the underlying causes of problems or events. It is also known as an Ishikawa Diagram or Cause-and-Effect Diagram.
How do I create a Lab Fishbone Template in Word?
+To create a Lab Fishbone Template in Word, open a new Word document and set the page orientation to landscape. Draw a large fishbone shape on the page and write the problem statement at the head of the fishbone. Identify the major categories of causes and draw lines branching out from the spine for each category. Brainstorm and list the potential causes within each category.
What are the benefits of using a Fishbone Diagram?
+The benefits of using a Fishbone Diagram include identifying the root cause of a problem, encouraging a structured approach to problem-solving, facilitating collaboration and communication among team members, providing a visual representation of the relationships between different causes, and helping to identify and prioritize potential causes.
We hope this comprehensive guide has helped you to create a Lab Fishbone Template in Word for root cause analysis. By using this template, you can identify the underlying causes of problems or events in your laboratory and develop effective solutions to prevent similar problems from occurring in the future.
