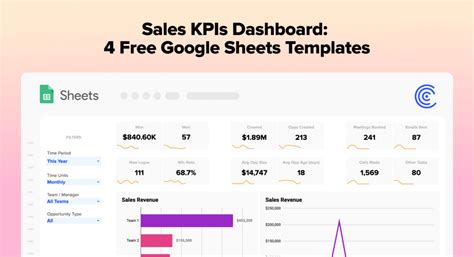
Effective key performance indicator (KPI) tracking is crucial for businesses to measure success, identify areas for improvement, and make data-driven decisions. Google Sheets provides a versatile platform for creating customizable KPI templates. Here, we'll explore seven essential KPI templates in Google Sheets, discussing their importance, benefits, and implementation.
1. Sales and Revenue KPI Template

Benefits:
- Monitor sales growth and revenue trends
- Analyze customer acquisition costs and return on investment (ROI)
- Identify top-performing sales channels and products
Implementation:
- Set up a table with columns for date, sales channel, revenue, and customer acquisition costs
- Use formulas to calculate totals, averages, and percentages
- Create charts and graphs to visualize sales and revenue trends
2. Marketing KPI Template

Benefits:
- Monitor website traffic and engagement metrics (e.g., bounce rate, time on page)
- Analyze social media performance (e.g., followers, engagement rate)
- Track lead generation and conversion rates
Implementation:
- Set up a table with columns for date, marketing channel, website traffic, social media metrics, and lead generation
- Use formulas to calculate totals, averages, and percentages
- Create charts and graphs to visualize marketing performance trends
3. Customer Service KPI Template

Benefits:
- Monitor response times and resolution rates
- Analyze customer satisfaction (e.g., CSAT, NPS)
- Identify areas for improvement in customer service
Implementation:
- Set up a table with columns for date, customer service channel, response time, resolution rate, and customer satisfaction
- Use formulas to calculate totals, averages, and percentages
- Create charts and graphs to visualize customer service performance trends
4. Employee Performance KPI Template

Benefits:
- Monitor employee productivity and quality metrics
- Analyze training and development needs
- Identify top-performing employees and areas for improvement
Implementation:
- Set up a table with columns for date, employee name, productivity metrics, quality metrics, and training needs
- Use formulas to calculate totals, averages, and percentages
- Create charts and graphs to visualize employee performance trends
5. Financial KPI Template

Benefits:
- Monitor revenue and expense trends
- Analyze cash flow and liquidity
- Identify areas for cost reduction and optimization
Implementation:
- Set up a table with columns for date, revenue, expenses, and cash flow
- Use formulas to calculate totals, averages, and percentages
- Create charts and graphs to visualize financial performance trends
6. Project Management KPI Template

Benefits:
- Monitor project timeline and milestones
- Analyze budget and cost performance
- Identify areas for improvement in resource allocation
Implementation:
- Set up a table with columns for date, project name, timeline, budget, and resource allocation
- Use formulas to calculate totals, averages, and percentages
- Create charts and graphs to visualize project performance trends
7. IT and Operations KPI Template

Benefits:
- Monitor system uptime and network performance
- Analyze inventory management and supply chain performance
- Identify areas for improvement in IT and operational efficiency
Implementation:
- Set up a table with columns for date, IT system, network performance, inventory management, and supply chain metrics
- Use formulas to calculate totals, averages, and percentages
- Create charts and graphs to visualize IT and operational performance trends
Gallery of KPI Templates


What is a KPI template?
+A KPI template is a pre-designed spreadsheet or document that helps businesses track and analyze their key performance indicators (KPIs).
Why do I need a KPI template?
+A KPI template helps businesses streamline their KPI tracking and analysis, providing a clear and concise visual representation of their performance.
How do I create a KPI template in Google Sheets?
+To create a KPI template in Google Sheets, start by setting up a table with columns for your KPIs, then use formulas and charts to calculate and visualize your data.
