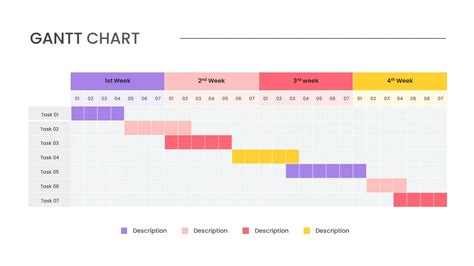
A Gantt chart is a type of bar chart that illustrates a project schedule, helping teams plan, coordinate, and track progress. Using a Gantt chart template in Google Slides can make creating and sharing these visual aids a breeze. Here's a comprehensive guide to get you started.
Why Use a Gantt Chart?
Before we dive into the world of Gantt charts in Google Slides, let's quickly explore the benefits of using these visual tools:
- Improved project planning: Gantt charts help teams break down complex projects into manageable tasks, allocate resources, and set realistic deadlines.
- Enhanced collaboration: By sharing a Gantt chart, team members can stay on the same page, track progress, and identify potential roadblocks.
- Increased productivity: With a clear visual representation of the project timeline, teams can focus on tasks, avoid bottlenecks, and deliver results more efficiently.

Creating a Gantt Chart Template in Google Slides
Now that we've covered the benefits, let's move on to creating a Gantt chart template in Google Slides:
- Open Google Slides: Start by opening a new Google Slides presentation or navigate to an existing one.
- Insert a Table: Go to the "Insert" menu and select "Table." Choose a table with the desired number of rows and columns to represent your project tasks and timeline.
- Customize the Table: Format the table to resemble a Gantt chart. Use the first column for task names, the second column for start dates, and the third column for end dates.
- Add Task Bars: Use the "Draw" tool to create bars that represent the duration of each task. You can color-code these bars to differentiate between tasks.
- Add Dependencies: Use arrows to indicate dependencies between tasks, helping team members understand the workflow.
- Format and Refine: Adjust the table's formatting, add headers, and refine the layout to make your Gantt chart template easy to read and understand.

Tips for Using Your Gantt Chart Template
Here are some additional tips to help you get the most out of your Gantt chart template in Google Slides:
- Regularly Update the Chart: Ensure that your Gantt chart reflects the current project status by regularly updating task completion percentages, deadlines, and dependencies.
- Share with Team Members: Share the Gantt chart with your team to facilitate collaboration, discussion, and progress tracking.
- Use Conditional Formatting: Use conditional formatting to highlight critical tasks, deadlines, and milestones, making it easier to focus on high-priority tasks.

Common Gantt Chart Template Mistakes to Avoid
When creating a Gantt chart template in Google Slides, be mindful of the following common mistakes:
- Insufficient Task Details: Failing to provide enough information about each task can lead to confusion and miscommunication.
- Inaccurate Dependencies: Incorrectly identifying dependencies between tasks can cause delays and bottlenecks.
- Poor Formatting: A cluttered or poorly formatted Gantt chart can make it difficult to read and understand.
Best Practices for Creating a Gantt Chart Template
To create an effective Gantt chart template in Google Slides, follow these best practices:
- Keep it Simple: Avoid overwhelming the chart with too much information. Focus on essential tasks, deadlines, and dependencies.
- Use Clear Labels: Use clear and concise labels for tasks, dates, and dependencies to ensure everyone understands the chart.
- Regularly Review and Update: Regularly review and update the Gantt chart to reflect changes in the project scope, timeline, or resources.


Conclusion
In conclusion, creating a Gantt chart template in Google Slides can be a powerful tool for project management and team collaboration. By following the tips and best practices outlined in this article, you can create an effective Gantt chart that helps your team stay organized, focused, and productive.
FAQs
Q: What is a Gantt chart?
A: A Gantt chart is a type of bar chart that illustrates a project schedule, helping teams plan, coordinate, and track progress.
Q: How do I create a Gantt chart template in Google Slides?
A: To create a Gantt chart template in Google Slides, start by inserting a table, customizing it to resemble a Gantt chart, and adding task bars and dependencies.
Q: What are some common mistakes to avoid when creating a Gantt chart template?
A: Common mistakes include insufficient task details, inaccurate dependencies, and poor formatting.
Q: What are some best practices for creating a Gantt chart template?
A: Best practices include keeping it simple, using clear labels, and regularly reviewing and updating the chart.
What is a Gantt chart?
+A Gantt chart is a type of bar chart that illustrates a project schedule, helping teams plan, coordinate, and track progress.
How do I create a Gantt chart template in Google Slides?
+To create a Gantt chart template in Google Slides, start by inserting a table, customizing it to resemble a Gantt chart, and adding task bars and dependencies.
What are some common mistakes to avoid when creating a Gantt chart template?
+Common mistakes include insufficient task details, inaccurate dependencies, and poor formatting.
