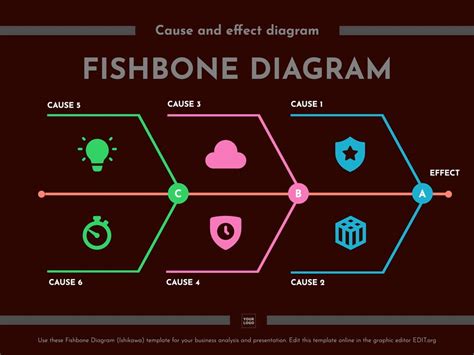
The fishbone diagram, also known as the Ishikawa diagram or cause-and-effect diagram, is a powerful tool used to identify and organize the various causes of a problem. It is shaped like a fishbone, with the problem statement at the head and the various causes branching out from there. This diagram is widely used in quality management and problem-solving activities, particularly in the Six Sigma methodology.
In this article, we will explore how to create a fishbone diagram template for Excel analysis, and provide guidance on how to use it effectively.
Understanding the Fishbone Diagram
The fishbone diagram is a visual representation of the relationships between different variables and the problem statement. It is composed of the following elements:
- Head: The problem statement, which is the main issue that needs to be addressed.
- Bones: The major categories of causes, which are typically represented by the following:
- People (or Man)
- Materials
- Machines (or Equipment)
- Methods
- Measurements
- Environment (or Mother Nature)
- Branches: The sub-causes that branch out from each bone, which provide more specific details about the causes.
- Root causes: The underlying reasons that contribute to the problem statement.
Creating a Fishbone Diagram Template in Excel
To create a fishbone diagram template in Excel, follow these steps:
- Open a new Excel spreadsheet and create a table with the following columns:
- Category (e.g., People, Materials, Machines, etc.)
- Sub-cause
- Description
- Root Cause
- Create a separate sheet for the fishbone diagram, and insert a chart or diagram that resembles a fishbone.
- Use the following formulas to create the bones and branches:
- Use the
TEXTfunction to create the bone labels (e.g.,=TEXT(A2," Category")) - Use the
VLOOKUPfunction to populate the sub-cause and description columns (e.g.,=VLOOKUP(B2,Sheet1!A:C,2,FALSE))
- Use the
- Use conditional formatting to highlight the different bones and branches.
Here is an example of what the fishbone diagram template might look like in Excel:
| Category | Sub-cause | Description | Root Cause |
|---|---|---|---|
| People | Training | Lack of training on new equipment | |
| Materials | Quality | Poor quality of raw materials | |
| Machines | Maintenance | Inadequate maintenance of equipment | |
| Methods | Process | Inefficient process design | |
| Measurements | Calibration | Calibration issues with measuring instruments | |
| Environment | Temperature | Extreme temperatures affecting production |
Using the Fishbone Diagram Template
To use the fishbone diagram template effectively, follow these steps:
- Identify the problem statement: Clearly define the problem that needs to be addressed, and write it down in the head of the fishbone diagram.
- Brainstorm the bones: Identify the major categories of causes that might be contributing to the problem statement. Use the standard bones (People, Materials, Machines, etc.) as a starting point.
- Generate sub-causes: For each bone, brainstorm specific sub-causes that might be contributing to the problem statement. Use the
VLOOKUPfunction to populate the sub-cause and description columns. - Analyze the root causes: Review the sub-causes and identify the underlying root causes that are contributing to the problem statement. Use the
Root Causecolumn to document the root causes. - Prioritize the causes: Prioritize the causes based on their impact on the problem statement. Use conditional formatting to highlight the most critical causes.
Tips and Variations
Here are some tips and variations to consider when using the fishbone diagram template:
- Use a team approach: Involve a team of stakeholders in the brainstorming and analysis process to ensure that all perspectives are represented.
- Use different colors: Use different colors to highlight different bones and branches, making it easier to visualize the relationships between the causes.
- Add additional columns: Add additional columns to the template to capture additional information, such as the impact of each cause on the problem statement or the feasibility of addressing each cause.
- Use it for decision-making: Use the fishbone diagram template to support decision-making, by identifying the most critical causes and prioritizing them for action.
Gallery of Fishbone Diagram Examples
Here is a gallery of fishbone diagram examples to illustrate different variations and applications:


FAQ
Q: What is a fishbone diagram? A: A fishbone diagram, also known as an Ishikawa diagram or cause-and-effect diagram, is a visual representation of the relationships between different variables and a problem statement.
Q: How do I create a fishbone diagram template in Excel? A: To create a fishbone diagram template in Excel, follow the steps outlined in this article, including creating a table with the necessary columns, inserting a chart or diagram, and using formulas to populate the bones and branches.
Q: What are the standard bones used in a fishbone diagram? A: The standard bones used in a fishbone diagram are People, Materials, Machines, Methods, Measurements, and Environment.
Q: How do I use the fishbone diagram template effectively? A: To use the fishbone diagram template effectively, follow the steps outlined in this article, including identifying the problem statement, brainstorming the bones, generating sub-causes, analyzing the root causes, and prioritizing the causes.
