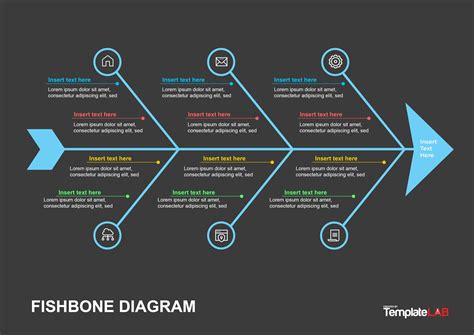
The fishbone diagram, also known as the Ishikawa diagram or cause-and-effect diagram, is a powerful tool used to identify and organize the possible causes of a problem. It is a visual representation of the various factors that contribute to a specific issue, and it is shaped like a fishbone, with the problem statement at the head and the causes branching out like bones. In this article, we will explore seven ways to use a fishbone diagram PowerPoint template to enhance your problem-solving skills.
A fishbone diagram is a valuable tool for anyone looking to solve complex problems in a structured and methodical way. By using a fishbone diagram PowerPoint template, you can create a clear and concise visual representation of the problem and its causes, making it easier to identify and address the root causes.
Here are seven ways to use a fishbone diagram PowerPoint template:
1. Identify the Problem Statement

Before creating a fishbone diagram, it is essential to define the problem statement. The problem statement is a clear and concise description of the issue you want to solve. A well-defined problem statement will help you focus on the root causes of the problem and ensure that everyone involved in the problem-solving process is on the same page.
How to Write a Problem Statement
To write a problem statement, follow these steps:
- Clearly define the problem
- Identify the key stakeholders
- Determine the impact of the problem
- Specify the goals and objectives
2. Identify the Major Causes

Once you have defined the problem statement, the next step is to identify the major causes of the problem. These are the broad categories of causes that contribute to the problem. The major causes are usually listed as the primary branches of the fishbone diagram.
Common Major Causes
Some common major causes include:
- Equipment
- Materials
- People
- Environment
- Procedures
3. Identify the Root Causes

After identifying the major causes, the next step is to identify the root causes. These are the specific factors that contribute to the major causes. The root causes are usually listed as the secondary branches of the fishbone diagram.
Tools for Identifying Root Causes
Some tools for identifying root causes include:
- Brainstorming
- Mind mapping
- SWOT analysis
- Root cause analysis
4. Analyze the Data

Once you have identified the root causes, the next step is to analyze the data. This involves collecting and analyzing data to determine the frequency and impact of each root cause.
Tools for Data Analysis
Some tools for data analysis include:
- Statistical process control
- Pareto analysis
- Scatter plots
- Correlation analysis
5. Develop a Solution

After analyzing the data, the next step is to develop a solution. This involves identifying the most effective solutions to address the root causes of the problem.
Tools for Developing Solutions
Some tools for developing solutions include:
- Brainstorming
- Mind mapping
- SWOT analysis
- Decision trees
6. Implement the Solution

Once you have developed a solution, the next step is to implement it. This involves putting the solution into action and monitoring its effectiveness.
Tools for Implementing Solutions
Some tools for implementing solutions include:
- Project management
- Change management
- Quality control
- Performance metrics
7. Evaluate the Results

After implementing the solution, the final step is to evaluate the results. This involves monitoring the effectiveness of the solution and making adjustments as needed.
Tools for Evaluating Results
Some tools for evaluating results include:
- Performance metrics
- Quality control
- Customer feedback
- Financial analysis


What is a fishbone diagram?
+A fishbone diagram, also known as an Ishikawa diagram or cause-and-effect diagram, is a visual representation of the various factors that contribute to a specific problem or issue.
What are the benefits of using a fishbone diagram?
+The benefits of using a fishbone diagram include identifying and organizing the possible causes of a problem, developing a clear and concise problem statement, and analyzing the data to determine the frequency and impact of each root cause.
How do I create a fishbone diagram?
+To create a fishbone diagram, start by defining the problem statement, then identify the major causes and root causes of the problem. Use a fishbone diagram PowerPoint template to create a clear and concise visual representation of the problem and its causes.
In conclusion, a fishbone diagram is a powerful tool for identifying and solving complex problems. By using a fishbone diagram PowerPoint template, you can create a clear and concise visual representation of the problem and its causes, making it easier to identify and address the root causes. Remember to define the problem statement, identify the major causes and root causes, analyze the data, develop a solution, implement the solution, and evaluate the results.
